By Caroline Mwanga
NEW YORK (IDN) – A new report released at the UN High-Level Political Forum challenges the traditional concept of poverty and sheds light on the number of people experiencing poverty at regional, national and subnational levels, and reveals inequalities across countries and among the poor themselves.
Findings from the 2019 global Multidimensional Poverty Index (MPI) and the publication “Illuminating Inequalities” – jointly developed by the United Nations Development Programme (UNDP) and the Oxford Poverty and Human Development Initiative (OPHI), and released on July 11, 2019 – offers data for 101 countries, covering 76 percent of the world population.
Of the 1.3 billion people who are described as “multidimensionally poor”, more than two-thirds—886 million—live in middle-income countries. A further 440 million live in low-income countries. In both groups, data show, simple national averages can hide enormous inequality in patterns of poverty within countries.
The MPI provides a comprehensive and in-depth picture of global poverty – in all its dimensions – and monitors progress towards Sustainable Development Goal (SDG) 1 – to end poverty in all its forms. It also offers policymakers with the data to respond to the call of Target 1.2, which is to “reduce at least by half the proportion of men, women, and children of all ages living in poverty in all its dimensions according to national definition”.
The publication Illuminating Inequalities previews ongoing research into trends over time for a group of countries including Bangladesh, Democratic Republic of Congo, Ethiopia, Haiti, India, Nigeria, Pakistan, and Peru. SDG target 10.1 calls for tracking the progress of the bottom 40 percent of the population compared with that of the total population – the publication includes case studies and a detailed analysis of the growth of those furthest behind – the “bottom 40%”.
“To fight poverty, one needs to know where poor people live. They are not evenly spread across a country, not even within a household,” says Achim Steiner, UNDP Administrator. “The 2019 global Multidimensional Poverty Index provides the detailed information policy makers need to more effectively target their policies.”
The MPI goes beyond income as the sole indicator for poverty, by exploring the ways in which people experience poverty in their health, education, and standard of living.
For instance, in Uganda 55 percent of the population experience multidimensional poverty—similar to the average in Sub-Saharan Africa. But Kampala, the capital city, has an MPI rate of six percent, while in the Karamoja region, the MPI soars to 96 percent—meaning that parts of Uganda span the extremes of Sub-Saharan Africa.
There is even inequality under the same roof. In South Asia, for example, almost a quarter of children under five live in households where at least one child in the household is malnourished and at least one child is not.
“We need—even amongst those living in poverty—to understand people’s different experiences of deprivation. Are they malnourished? Can they go to school? Only then will poverty reduction policies be both efficient and effective,“ says Pedro Conceição, Director of the Human Development Report Office at UNDP.
There is also inequality among the poor. Findings of the 2019 global MPI also paint a detailed picture of the many differences in how – and how deeply – people experience poverty. Deprivations among the poor vary enormously: in general, higher MPI values go hand in hand with greater variation in the intensity of poverty.
Results also show that children suffer poverty more intensely than adults and are more likely to be deprived in all 10 of the MPI indicators, lacking essentials such as clean water, sanitation, adequate nutrition or primary education.
Even more staggering is the finding that worldwide, one in three children is multidimensionally poor, compared to one in six adults. That means that nearly half of the people living in multidimensional poverty—663 million—are children, with the youngest children bearing the greatest burden.
But new data also shows a positive trend: those furthest behind are moving up the fastest.
“We looked at data for a group of ten middle- and low-income countries and we found encouraging news that the bottom 40 percent were moving faster than the rest,” says Sabina Alkire, OPHI Director. “A pro-poor pattern that reduces inequalities in several Sustainable Development Goals.”
Within these ten countries, data show that 270 million people moved out of multidimensional poverty from one survey to the next. This progress was largely driven by South Asia: in India there were 271 million fewer people in poverty in 2016 than in 2006, while in Bangladesh the number dropped by 19 million between 2004 and 2014.
In other countries there was less—or no—absolute reduction, with numbers of multidimensionally poor rising by 28 million across the three African countries considered. In part this was because of rapid population growth, which outstripped reductions in poverty. In fact, poverty rates (as a percentage of the population) declined in most of the countries.
The 2019 global MPI paints a detailed picture of poverty for 101 countries and 1,119 subnational regions covering 76 percent of the global population, going beyond simple income-based measures to look at how people experience poverty every day. [IDN-InDepthNews – 15 July 2019]
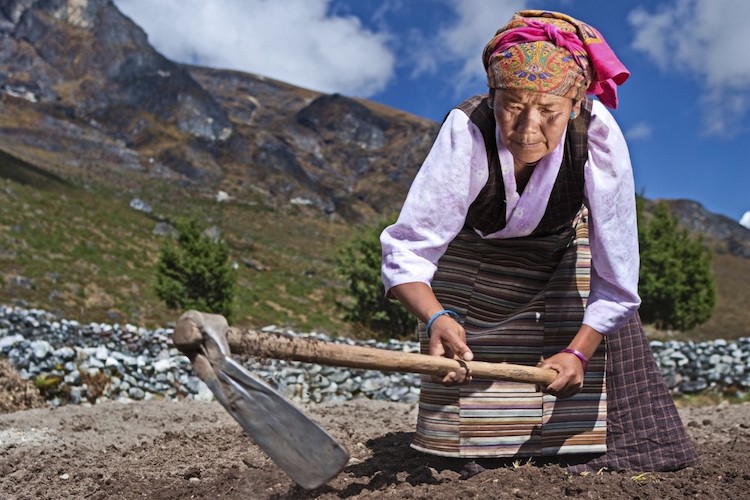
Photo credit: UNDP Nepal
IDN is flagship agency of the International Press Syndicate.
facebook.com/IDN.GoingDeeper – twitter.com/InDepthNews
Send your comment: comment@indepthnews.colo.ba.be
Subscribe to IDN Newsletter: newsletter@indepthnews.colo.ba.be

