By Simon Evans and Dr Verner Viisainen
The following excerpts from an article, issued by Carbon Brief, and being republished under a CC license
LONDON | 23 June 2024 (IDN) — In 2023, wind and solar combined added more new energy to the global mix than any other source, for the first time in history, according to Carbon Brief analysis of newly released data.
Nevertheless, record global demand for energy saw coal and oil use also reaching new highs last year, the Energy Institute Statistical Review of World Energy 2024 finds.
This pushed global carbon dioxide (CO2) emissions to another record in 2023, the world’s first full year with no impact from the coronavirus pandemic, the data shows.
Key figures from the report include:
- Global energy demand reached a record high of 620 exajoules (EJ) in 2023, with annual growth of 2.0%, slightly above the 1.5% per year average for the last decade.
- Wind and solar together were the largest source of new energy in 2023, adding 4.9EJ or 40% of the increase overall. The rest of the net increase came from oil (+4.8EJ, 39% of the increase), coal (+2.5EJ, 20%), nuclear (+0.4EJ, 4%) and other non-hydro renewables (+0.5EJ, 4%), while gas stayed flat and hydro declined (-0.9EJ, -8%).
- Global energy use from coal grew 1.6% year-on-year to a record high of 164EJ, passing the previous record of 162EJ, set a decade earlier in 2014.
- Global energy use from oil grew 2.5% to a record high of 196EJ, comfortably above the previous high of 193EJ set in 2019, before the coronavirus pandemic.
- Global energy use from gas was unchanged at 144EJ. It has now flatlined for two years since the global energy crisis, due to Russia cutting off gas supplies to Europe.
- Global electricity generation from coal grew by 189 terawatt hours (TWh, 1.8%) year-on-year to a record high of 10,513TWh. This was despite wind and solar adding a record 537TWh of new generation, up a combined 15.7% year-on-year to 3,967TWh.
- The new highs for coal and oil use drove global emissions to another record, with releases from fossil fuel burning, industrial processes, methane and flaring topping 40bn tonnes of carbon dioxide equivalent (GtCO2e) for the first time.
With global temperatures inching closer to the 1.5C limit, time is running out to peak and then decline emissions in order to avoid dangerous levels of warming. The new figures show the world is still going in the wrong direction, with new records for coal, oil and CO2 emissions.
Yet there are hints that, beyond today’s data for 2023, the world could be turning a corner, as emissions from China—and the global electricity system—may already have peaked.
This is the second edition of the statistical review published by the Energy Institute. Carbon Brief covered earlier editions, published by oil major BP, in 2015, 2016, 2017, 2018, 2019 and 2020.
One of the most striking details in this year’s report is that wind and solar, when combined, added more new energy to the global mix in 2023 than any other source, as shown in the figure below.
The combined 4.9EJ of new energy from wind and solar in 2023 accounted for 40% of the overall increase in global demand, ahead of oil (39%) and coal (20%).
This is the first time in history that these newer forms of renewable energy have outpaced each of the fossil fuels, which remain the world’s dominant sources of energy.
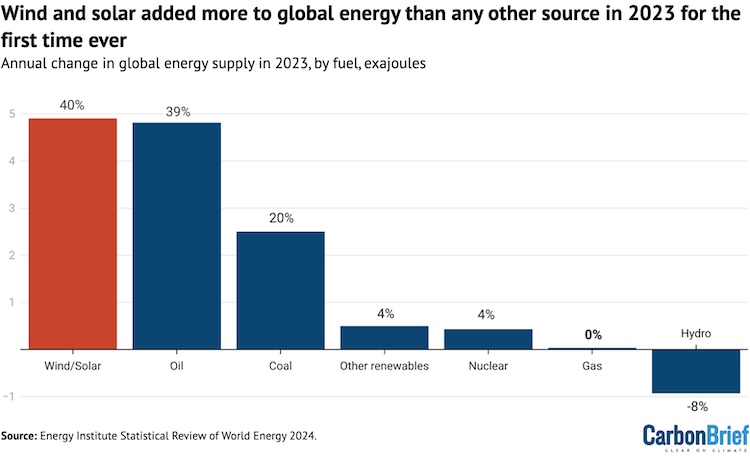
Still, the significant increases in demand for energy from oil (+4.8EJ) and coal (+2.5EJ), shown in the figure above, resulted in yet another increase in global CO2 emissions.
The drop in hydro output—also shown above—resulted from major droughts around the world in 2023, particularly in China. This shortfall was largely met by increased coal power.
Along with the continued rapid expansion of wind and solar, a recovery in hydro generation from last year’s lows is expected to contribute to a peak in emissions from the global power sector.
While global demand for oil and gas is not expected to peak until later this decade, reductions in coal use could still drive a near-term peak in global CO2 emissions.
Record highs for coal and oil
The record 4.9EJ of new energy added by wind and solar in 2023 marks a continuation of their rapid growth over the past decade, shown in the figure below.
In combination, wind and solar now contribute 37EJ to the global energy system, up 15% year-on-year. Their combined output has grown at an average 17% per year for the past decade, taking them from a total of just 8EJ in 2013 to the 2023 figure of 37EJ.
Still, it is clear from the figure that the global energy system remains heavily reliant on fossil fuels.
At a new record of 196EJ in 2023, oil is the world’s largest source of energy, accounting for nearly a third of the total (32%) energy mix and having grown nearly every year for the past half-century.
Coal is in second place, at 164EJ in 2023 or 26% of the mix. While this, too, marks a new record, global coal demand has been flat for the past decade. Indeed, at one point it seemed that the previous 2014 record of 162EJ might have marked a lasting peak for the fuel.
Notably, the figure above shows that global gas demand has now flatlined for the past two years. While the future trajectory for the fuel remains uncertain, this recent trend illustrates why the International Energy Agency (IEA) said in late 2022 that the “golden age of gas” had been brought to an end by the global energy crisis, following Russia’s invasion of Ukraine earlier that year.
In total, fossil fuels met some 81.5% of global primary energy demand in 2023, as shown in the figure below. While this is a record low, it is only around 4 percentage points lower than a decade earlier – and 5 percentage points below the level seen in 1990.
Energy Institute chief executive Nick Wayth told a pre-release press briefing that the data could be interpreted to suggest that the global energy transition “has not even started”:
“At the global level, today’s new data provides little encouragement in terms of global climate change mitigation. Clean energy is still not even meeting the entirety of demand growth and therefore at a global level not displacing fossil fuels. Arguably, the transition has not even started.”
However, this interpretation hides a “lopsided” picture for different parts of the world, Wayth said. “Fossil demand is likely to be peaking” in the major economies of Europe and the US, he explained, even as countries in the Global South are “still carbonising”.
Electricity system in flux
To date, the energy transition has had the most dramatic impact on the global electricity system, as the figure below shows. Wind and solar generation has grown from a combined 774TWh in 2013 to nearly 4,000TWh in 2023 – more than quintupling in a decade.
Together, wind and solar accounted for 13% of global electricity supplies in 2023, up from 3% a decade earlier. Still, rapidly-rising demand for electricity, which is expected to accelerate as heat, transport and industry are increasingly electrified, means that coal power reached a record high of 10,513TWh in 2023.This cements its position as the single-largest contributor to the mix.
Low-carbon sources of clean energy, including nuclear and renewables, now make up a record high 39% of global electricity supplies, ahead of coal at 35%. With gas making up a further 23% of the mix, the majority of the world’s electricity is still being generated with fossil fuels.
The expansion of wind and solar is expected to continue and even accelerate – particularly if the global goal of tripling renewable capacity by 2030 is to be met.
Combined with a recovery in global hydropower output, following a series of major droughts, this could force fossil fuel power into the beginning of structural decline in 2024.
Record CO2 emissions
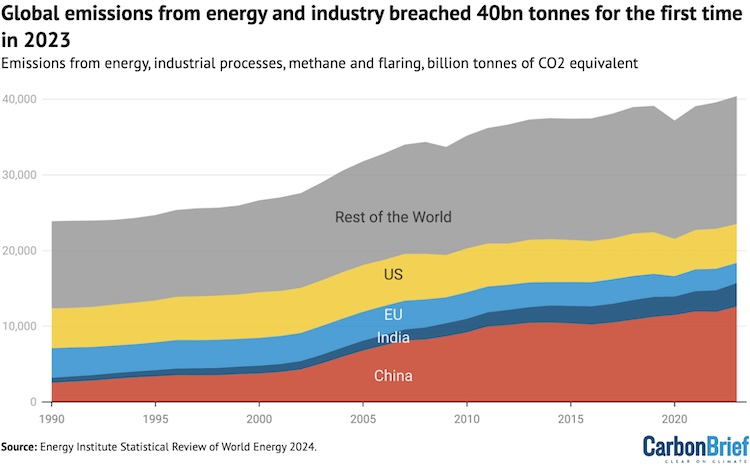
Taking all of the pieces together, the record for coal and oil use along with flat demand for gas means global CO2 emissions reached a new high in 2023, the Energy Institute’s data shows. This is despite the record amounts of new energy added by wind and solar power.
China’s emissions grew by 708m tonnes of CO2e (MtCO2e, 6%) year-on-year, accounting for 85% of the net increase globally (829MtCO2e). India’s emissions also grew strongly, up 257MtCO2e (9%), while emissions in the US and EU fell by 140MtCO2 (2.7%) and 188MtCO2e (6.6%) respectively.
The Energy Institute estimate confirms earlier analysis from the Global Carbon Project (GCP) and the IEA, both of which found fossil fuel CO2 emissions had reached a new record high in 2023.
However, GCP estimates including CO2 emissions from land use change put 2023 just below the record set in 2019, with the total having been roughly flat for a decade.
Looking ahead, the key question for global emissions is whether China has already peaked and, if so, how quickly its emissions begin to fall. If it has, then it would add to continued emissions reductions in developed countries and likely outweigh increases elsewhere. [IDN-InDepthNews]
Original link: https://www.carbonbrief.org/analysis-wind-and-solar-added-more-to-global-energy-than-any-other-source-in-2023/
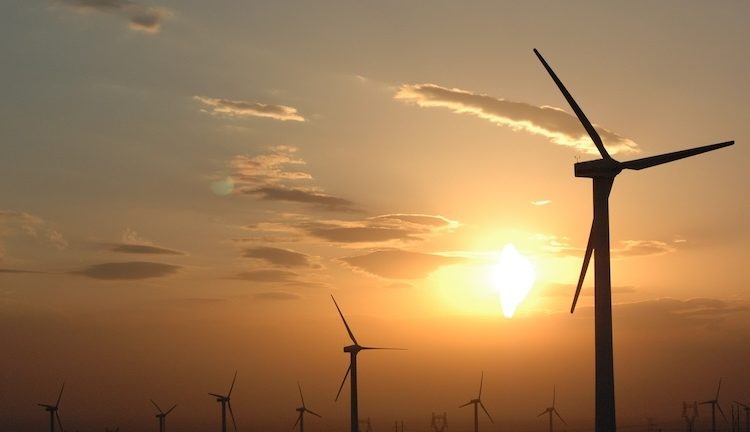
Photo: Wind farm in Xinjiang, China. CC BY-SA 2.0
Original link: https://www.carbonbrief.org/analysis-wind-and-solar-added-more-to-global-energy-than-any-other-source-in-2023/
Photo: Wind farm in Xinjiang, China. CC BY-SA 2.0
